rd-mpua-samples:	tephra sample locations and descriptions
mpua-contour:	isomass contours for event or event package (The files included in this layer are:  mp143-mpua2-4-contour, mp143-mpua5-contour, mp143-mpua6-contour, mp143-mpua7-8-contour, mp143-mpua9-18-contour, mp143-mpua19-contour.)
Schaefer, J. R., and Wallace, K. L., 2012, Ash fall contour map of the 2009 eruption of Redoubt Volcano, Alaska: Digital shapefiles of contours and sample locations: Miscellaneous Publication MP 143, State of Alaska, Department of Natural Resources, Division of Geological & Geophysical Surveys, Fairbanks, AK, USA.Online Links:
This is a Vector data set.
Horizontal positions are specified in geographic coordinates, that is, latitude and longitude. Latitudes are given to the nearest 0.00001. Longitudes are given to the nearest 0.00001. Latitude and longitude values are specified in Decimal degrees.
The horizontal datum used is North American Datum of 1983.
The ellipsoid used is Geodetic Reference System 80.
The semi-major axis of the ellipsoid used is 6378137.
The flattening of the ellipsoid used is 1/298.257222101.
Station Identifier
Sample Identifier
Sample identifier assigned by the USGS Alaska tephra lab; blank field indicates Alaska tephra lab number not assigned
General location description. This is not a required field, so some fields are left blank.
| Range of values | |
|---|---|
| Minimum: | 3/23/2009 |
| Maximum: | 7/11/2009 |
| Range of values | |
|---|---|
| Minimum: | 3/23/2009 |
| Maximum: | 7/11/2009 |
| Value | Definition |
|---|---|
| Tephra Fall | Tephra fall deposit |
Description of sample type
Description of sample; extracted from AVO's sample database where this field has unlimitied text, so some text descriptions may be truncated as a result of transferring the data to shapefile format.
| Range of values | |
|---|---|
| Minimum: | 2 |
| Maximum: | 60814 |
| Units: | grams per square meter |
Blank: No MPUA value determined
Where confidently known, the event or event package is listed. Blank field indicate an event or event package could not be determined.
| Value | Definition |
|---|---|
| ua | unassigned. stratigraphy was looked at closely, but an event or event package could not be assigned. |
Explosive event or event package number that was assigned to a sample.
| Range of values | |
|---|---|
| Minimum: | 59.434803 |
| Maximum: | 63.06955 |
| Units: | decimal degrees |
| Range of values | |
|---|---|
| Minimum: | -154.55103 |
| Maximum: | -149.168935 |
| Units: | decimal degrees |
| Value | Definition |
|---|---|
| visual MODIS extent | The extent to which ash could be visually recognized on snow in MODIS imagery following Event 6, see Entity_and_Attribute_Overview |
label for isomass contour, the numeric value indicates the interpreted surface ash density in grams per square meter
(907) 451-5029 (voice)
(907) 451-5050 (FAX)
dggsgis@alaska.gov
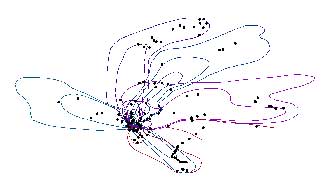
The purpose of this publication is to provide digital GIS files of ash fall isomass contour data, ash fall sample locations, event package assignments, and mass per unit area measurements for the ash fall that occurred during the 2009 eruption of Redoubt Volcano. These GIS files represent the data used to create Figure 12, on p.13 in Schaefer, J.R., ed., 2012, The 2009 eruption of Redoubt Volcano, Alaska, with contributions by Bull, Katharine, Cameron, Cheryl, Coombs, Michelle, Diefenbach, Angie, Lopez, Taryn, McNutt, Steve, Neal, Christina, Payne, Allison, Power, John, Schneider, Dave, Scott, William, Snedigar, Seth, Thompson, Glenn, Wallace, Kristi, Waythomas, Chris, Webley, Peter, and Werner, Cynthia: Alaska Division of Geological & Geophysical Surveys Report of Investigation 2011-5, 45 p., available at <http://dx.doi.org/10.14509/23123>.
An ArcGIS world file (tfw) was also created with the followig parameters: 250 0 0 -250 -1249875 1249875
Wallace, K.L., Schaefer, J.R., and Coombs, M.L., Unknown, Character, mass, distribution, and origin of tephra-fall deposits from the 2009 eruption of Redoubt Volcano, Alaska—highlighting the importance of particle aggregation: Journal of Volcanology and Geothermal Research in press.
Schaefer, Janet R., 2012, The 2009 eruption of Redoubt Volcano, Alaska, with contributions by Bull, K.F., Cameron, C.E., Coombs, M.L., Diefenbach, A.K., Lopez, Taryn, McNutt, S.R., Neal, C.A., Payne, A.L., Power, J.A., Schneider, D.J., Scott, W.E., Snedigar, S.F., Thompson, Glenn, Wallace, K.L., Waythomas, C.F., Webley, P.W., and Werner, C.A.: Report of Investigation RI 2011-5, State of Alaska, Department of Natural Resources, Division of Geological & Geophysical Surveys, Fairbanks, AK, USA.Online Links:
Isomass contours for all depositional event packages are based on three datasets: (1) mass-per-unit-area (MPUA) measurement of tephra samples, (2) ash on the ground as seen in MODIS imagery, and (3) FAA NEXRAD base reflectivity data. Tephra samples with MPUA measurements were used to define the contour location and contour values of each depositional event package. MODIS imagery acquired throughout the eruption provided a visual picture of both ash deposition (dark gray ash on white snow) as well as ash clouds in the atmosphere. All 19 ash-producing explosive events were mapped in a GIS using the NEXRAD base reflectivity data. This NEXRAD data was used to target field sites for tephra collection, provide plume size, location, and trajectory information, and interpret time-stratigraphic relationships of ash fall layers. Our final interpretation of the shape and value of the isomass contours results from the integrative analysis of all three of these datasets. The sample density, quality and timing of visual MODIS data, and occasional stratigraphic complexities results in varying degrees of certainty in the location and value of the isomass contours. To better define this qualitative uncertainty, a description of how the data was used to define the contours for each event package is summarized below. Event Package 2-4 (mp143-mpua2-4-contour): The value of the contours for event package 2-4 is defined by 32 samples collected between about 9 and 240 km from the vent. The overall shape of the contours is based on this sample data, a March 23 MODIS image showing ash on snow, and NEXRAD data. The 10 g/m2 boundary is highly uncertain, due to both lack of sample density and the difficulty in distinguishing the ash on snow versus lowland vegetation in the MODIS image. The construction of contours within about 70 km of the vent was inhibited by the deposition of Event 5 tephra directly on top of Event 4 tephra. In some cases, enough snow fell between events 4 and 5 to distinguish the deposits, however in some cases a composite sample had to be taken. The NEXRAD base reflectivity clearly defines a northeast trajectory that progressively moves northwestward with each successive explosion and this data was critical in determining the stratigraphic relationship of the samples collected and in understanding the mass-per-unit area values obtained. Event 5 (mp143-mpua5-contour): The shape and location of the outer 10 g/m2 contour for Event 5 is based on NEXRAD base reflectivity data showing the plume trajectory, as well as a MODIS image showing ash on the snow. The MODIS image was acquired on March 23, 2009, at 13:49 AKDT, approximately 9 hours after the Event 5 explosion, and clearly shows fresh ash on snow. The value assigned to this outer contour is well-defined by 17 MPUA samples collected within the northeastern lobe of ash fall, between 200 and 300 km from the vent. Twenty other samples taken closer to the vent define the 100 g/m2 and 1,000 g/m2 contours. Event 6 (mp143-mpua6-contour): Nineteen MPUA samples are assigned to Event 6 and are used to define the 20,000 g/m2, 3,000 g/m2, and 400 g/m2 contours. The outer line, with an unassigned value, marks the outer boundary of ash on snow seen in two MODIS images: March 24, 2009, at 12:54pm AKDT, and March 26, 2009, at 12:41pm AKDT. Even though ash could be seen on the snow in the MODIS images, we were unable to collect distal samples in the region so this area could not be included in the contouring and derivative volume calculation for Event 6. Event Package 7-8 (mp143-mpua7-8-contour): Event 7 was small compared to Event 8 and ash from this event was immediately covered by Event 8 deposits within about 20 km of the vent making the deposits from these two explosions indistinguishable within this area. All tephra collected on March 26 across Cook Inlet along the road system between Soldotna and Seldovia (~90-120 km from the vent) are Event 8 deposits. A total of 26 MPUA samples define the Event Package 7-8 contours. Much of the tephra from Event 8 fell into Cook Inlet so sampling density is sparse along the southeast-directed plume axis between about 40 and 70 km from the vent. A lack of sample density made it difficult to close the 10 and 2 g/m2 contours so open ended lines are drawn to designate approximate isomass contours between Ninilchik and Anchorage. Two MODIS images on March 26 clearly show ash deposition along the entire length of the Crescent River valley and lingering ash in the atmosphere for more than 300 km to the southeast along the plume trajectory as well as 300 km to the northeast in the upper Cook Inlet over Anchorage. Event Package 9-18 (mp143-mpua9-18-contour): Overlapping east-northeast trajectories, combined with little snowfall between Events 9 through 18, made it impossible to distinguish these events stratigraphically. A total of 58 samples are used to define event package 9-18 contours. NEXRAD data for all events helped constrain the shape of each contour. This is especially true for the northern and northeastern section of the 10 g/m2 contour where sample density is sparse. Here the contour encloses the area of high NEXRAD base reflectivity following Event 18. Event 19 (mp143-mpua19-contour): In eight near-vent locations within 30 km of the vent, Event 19 tephra was deposited directly on Event 8 tephra, so MPUA samples in these locations represent a composite of both Events 8 and 19. Seven other near-vent locations can be properly distinguished as Event 19, as well as ten other Event 19 samples that were collected the day of deposition across Cook Inlet on the road system between Ninilchik and Homer. The path of Event 19 airborne ash as well as ground deposition is easily seen in April 4 MODIS imagery. As with Event 8, sample density was limited due to deposition of ash in Cook Inlet, but the 10 distal samples combined with the eight proximal samples allow us to confidently construct four isomass contours.
Latitude and longitude locations of tephra fall samples were acquired with a hand-held GPS with a standard accuracy of approximately 10 to 20 meters. See Attribute Accuracy Report for a description of the uncertainties involved with the creation of the isomass contours.
Although several hundred geologic samples were collected during the 2009 Redoubt eruption, the sample descriptions included in this report consist only of tephra fall samples where a specific ash fall event or event package determination could be made. If ash fall could be specifically assigned to an explosive event, the event number or numbers are listed in the field 'FinalUnit' of shapefile: mp143-rd-mpua-samples.
Positional accuracy was checked by plotting sample locations and contours in a GIS and comparing placed points and contours with topography and map attributes.
Are there legal restrictions on access or use of the data?
- Access_Constraints:
- This report, map, and/or dataset are available directly from the State of Alaska, Department of Natural Resources, Division of Geological & Geophysical Surveys (see contact information below).
- Use_Constraints:
- Any hard copies or published datasets utilizing these datasets shall clearly indicate their source. If the user has modified the data in any way, the user is obligated to describe the types of modifications the user has made. User specifically agrees not to misrepresent these datasets, nor to imply that changes made by the user were approved by the State of Alaska, Department of Natural Resources, Division of Geological & Geophysical Surveys. The State of Alaska makes no express or implied warranties (including warranties for merchantability and fitness) with respect to the character, functions, or capabilities of the electronic data or products or their appropriateness for any user's purposes. In no event will the State of Alaska be liable for any incidental, indirect, special, consequential, or other damages suffered by the user or any other person or entity whether from the use of the electronic services or products or any failure thereof or otherwise. In no event will the State of Alaska's liability to the Requestor or anyone else exceed the fee paid for the electronic service or product.
907-451-5020 (voice)
907-451-5050 (FAX)
dggspubs@alaska.gov
MP 143
The State of Alaska makes no express or implied warranties (including warranties of merchantability and fitness) with respect to the character, function, or capabilities of the electronic services or products or their appropriateness for any user's purposes. In no event will the State of Alaska be liable for any incidental, indirect, special, consequential, or other damages suffered by the user or any other person or entity whether from the use of the electronic services or products, any failure thereof, or otherwise, and in no event will the State of Alaska's liability to the requester or anyone else exceed the fee paid for the electronic service or product.
DGGS publications are available as free online downloads or you may purchase paper hard-copies or digital files on CD/DVD or other digital storage media by mail, phone, fax, or email from the DGGS Fairbanks office. To purchase this or other printed reports and maps, contact DGGS by phone (907-451-5020), e-mail (dggspubs@alaska.gov), or fax (907-451-5050). Payment accepted: Cash, check, money order, VISA, or MasterCard. Turn around time is 1-2 weeks unless special arrangements are made and an express fee is paid. Shipping charge will be the actual cost of postage and will be added to the total amount due. Contact us for the exact shipping amount.
| Data format: | SHP |
|---|---|
| Network links: |
<http://dx.doi.org/10.14509/23463> |
907-451-5020 (voice)